3.5 Output File/ Rated Prediction File
Chapter 2 is the quick version of the manual, which listed the minimum requirement. After chapter 2, you should be able to operate the software. However, a few details were left out in chapter 2, like, what is the Precision level, what is Trend; what are all possible commands.
Chapter 3 and 4 will present a detailed user's guide. There will be some repetition between chapter 2 and chapter 3.
The operation has two phases:
In this chapter, we will discuss Phase 2: how to use the Predictor.
Phase 2 has 3 steps:
Predictor presents you with all possible predictions and how
valuable the Predictor thinks each prediction is via a confidence number.
This number is similar to the number in an Internet Search Engine: the
higher that number, the more confidence the Predictor has in that prediction.
The best way to learn the input file format is to look at the examples in the Predictor, for example, click "Example/Intel 2". The format is very easy to learn.
The input file must be prepared in the text file format. The Predictor has its own text editor. Or if you wish, you can use any word processor, like Microsoft Word, or WordPerfect; just make sure you save the data file in the text format.
The input file has three sections:
Comment Section --- Part 1 of the Input File
The comment section starts with a "*" and ends with another "*". The purpose of this section is to document your data:
Example:
Title: Intel stock prediction
Data set : 5-month moving average of Intel
Date: 11/91 - 9/98
Purpose: to predict the 5-month moving average, 10/98
*
Number of variables
--- Part 2 of the Input File
This section has a single integer, which will tell the Predictor how many variables you will use.
Example:
Data Section --- Part 3 of the Input File
This section contains the data.
Example Considering the Intel example which we showed you earlier. You can see a complete example of prepared data, which can used by the Predictor.
This example can be generated by clicking "Example/Intel 2". Note
that it has three sections: comment, the number of variables, and the data:
*Purpose: To predict next month Intel.
Data set: 5-month moving average of Intel, Nov-91 through Sep-98
Next 5-month moving average:
10/98 80.9378
*
1
6.7156
7.0282
7.0532
6.9814
6.8876
...
80.2004
78.8254
77.7754
76.4004
77.3878
Step 2: Link Input File To Predictor
Assume we want to link "D_int2a.txt" to the Predictor. There
are 4 methods to link the input file:
Method 1:
Method 3:
Input file: example2a.txtOutput file: example2b.txt
These files are automatically connected to the software. When
you prepare your own data files, unless you use the default file names
above, the data is not connected to Predictor.
All you have to do in this step is click one command. There are many commands in the Predictor. If you know the first 6 commands, you will know the rest.
Once you click a command, the results will be in an output file, which is opened for you automatically. We will explain the format of the output file later.
There are six basic commands (See Figure 5). All other commands are derived from these 6 commands. These 6 basic commands are:
Real
+ Linear
-- Linear0 Linear
+ Exponential
-- Exponential
0 Exponential
These commands are divided into two groups:
+ -- 0.
i.e. the result is likely to be 5.6, but could be in the range [5.4,
5.9]; then
'+' prediction ==> 5.9
'--' prediction ==> 5.4.
'+' and '--' predictions yield results more often than the '0' prediction,
therefore, consider these two commands first. '0' prediction, on other
hand, is more accurate than the other two, if it produces a prediction.
Example Linear Mode: Data is in fixed intervals.
Winning Numbers for CASH 3, Georgia, USA
1/1/97 - 1/10/97
01-Jan-97 6 2 7
02-Jan-97 6 0 5
03-Jan-97 1 8 8
04-Jan-97 5 1 2
05-Jan-97 4 0 3
06-Jan-97 6 0 8
07-Jan-97 9 9 9
08-Jan-97 2 2 2
09-Jan-97 0 1 9
10-Jan-97 6 3 5
Let a sequence be { 2, 4, 6, 8, 10, . . . , 98, 100, . . . }.
Example Exponential Mode: Data grows exponentially.
Intel stock is a typical example of the exponential mode:
Monthly prices (Nov 1991 to Oct 1998)
DATE HIGH LOW CLOSE VOLUME
Nov-91 5.531 4.969 5.125 275020000
Dec-91 6.156 5.031 6.125 260759200
Jan-92 7.875 5.906 7.484 589994400
Feb-92 8.594 7.375 7.938 340300800
...
Jun-98 77.625 65.656 74.125 360081300
Jul-98 88.25 72.25 84.438 396391200
Aug-98 92.625 70.938 71.188 440267900
Sep-98 89 69.75 85.75 369103300
Oct-98 90.813 75.813 89.188 393720800
The following two commands produce the upper bound:
Real /+ LinearReal /+ Exponential
The following two commands produce the lower bound:
Real /-- LinearIn general, you should use both commands and pick up number between the upper and lower bounds.Real /-- Exponential
In this section, we will introduce the rest of commands.
Real
+ Linear basic command-- Linear basic command
0 Linear basic command
+ Exponential basic command
-- Exponential basic command
0 Exponential basic command
The difference between the linear command and the linear enumerative command is that the enumerative command might offer more possibilities than the liner mode.
The enumerative command looks at all possibilities where the linear command only looks at the important possibilities. However, the enumerative mode can not examine more than 10,000 possibilities (for the 10,000-neuron version).
If your application requires a selection among more than 10,000 possibilities, you have to use the linear mode, or order a customized version. The 250K version, for example, will examine 250,000 possibilities.
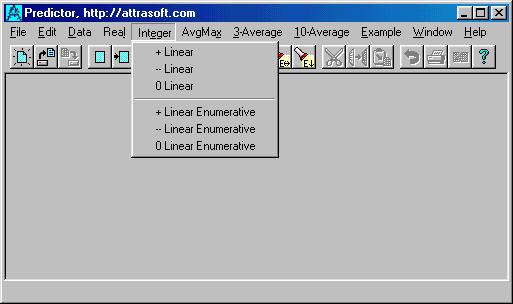
Figure 7. The "Integer" Commands
Integer
+ Linear
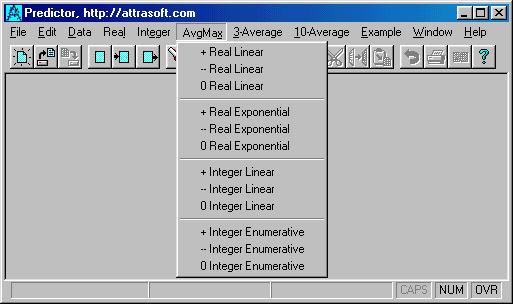
Figure 8. The "Avg/Max" Commands
Avg/Max
+ Real Linear
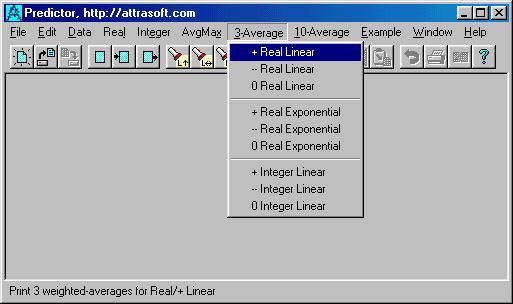
Figure 9. The "3-Average" Commands
3-Average and 10-Average
+ Real Linear
Output File/ Rated Prediction File
The default output file name is example2b.txt. You can change the output file name by clicking: "Data/Link", or its button on the toolbar, then type in your new data file name.
The "Real" and the "Integer" commands will have the following output format:
Example Intel 2.
1. Click "Example/Intel 2" to link the data to the Predictor. The input file will be opened at this point.
2. Click "Real/-- Exponential" and the output below will be displayed:
=================== Beginning =====================
Possibility Confidence*Probability
81.2484 6400
77.8113 10344
76.0928 4235
84.6855 273
88.1226 1
86.404 33
79.5299 168
74.3742 8320
82.9669 261
---------------------------------------------------
Weighted Average
77.476
Highest Probability
77.8113 10344
Error of each number
0.859271
=================== End ==========================
Relative Probability or Rating
Relative probability or rating is the ranking the predicted numbers.
This number is similar to an Internet Search Engine ranking number.
Predictor presents you with rated possibilities: all possibilities and how valuable the Predictor thinks each one is via a relative probability. These ratings are relative probabilities. In the above example, the distribution is:
Possibility Confidence*Probability
81.2484 6400
77.8113 10344
76.0928 4235
84.6855 273
88.1226 1
86.404 33
79.5299 168
74.3742 8320
82.9669 261
---------------------------------------------------
First of all, the predicted possibilities are
77.8113 ± 0.859271
...
Relative probabilities are proportional to probabilities. For example, let the relative probabilities be (3 5), then they represent the probabilities (3/(3+5), 5/(3+5) ) = (37.5%, 62,5%).
The highest relative probability is called the Confidence Number. This number is given after the weighted-average(s). This number is similar to the number in an Internet Search Engine: the higher that number, the more confidence the Predictor has in that prediction. For each prediction, one Confidence Number is produced. In the above example, the confidence is 10334.
Unfortunately, no quantitative description can be made for the Confidence Number. You can get a feel for this Confidence Number from experience. However, it is vitally important for you to grasp this number. You should ignore the prediction results all together if the confidence number is low.
Of course, you want the error as low as possible. This is not always
possible. The error is controlled by a user-defined variable, called Precision
level. The higher Precision level is, the lower the error will be.
We will discuss the Precision level in the next chapter.