2.2 Total Operation in 2 Clicks
2.4 Example: Intel stock Value
The detailed user's guide will be given in chapter 3 and 4. In this chapter, we will show you the minimum information to get started.
Assume you have a large database, say you have collected 30 years of data, and you want to make intelligent decisions based on the huge amounts of information in your database.
Here is your difficulty: you are overwhelmed by your terabyte
data and lose a sense of the direction in the data.
What are you going to do? Order Attrasoft Predictor.
The prediction process has two phases:
Phase 1: from your historical database, you will determine a data set, which consists of the relevant variables for the prediction. Then get the data for these variables, if necessary, preprocess them such as calculating the moving-average.
Phase 2: Prepare all your data in one file, then in 2 clicks, you will have your answer instantaneously:
Assuming in phase 1, you have accumulated the data.
Predictor presents you with all possible predictions and how
valuable the Predictor thinks each prediction is via a confidence number
or rating.
The confidence number is similar to the number in an Internet Search
Engine: the higher that number, the more confidence the Predictor has in
that prediction.
The Predictor predicts the values of the next period or next several periods. Take a stock data as an example,
In this section, we want to predict the Intel stock value for 10/98,
which is the latest data available to us at this time.
1. Data Set
A data set is your choice of the variables, which you think will give you the best prediction.
We will choose the Intel stock as the sole factor for the prediction, i.e., the data set is the Intel stock. (This is, of course, only for the purpose of demonstrating how to operate the Predictor. Attrasoft does not recommend you use any particular data set for a stock.)
2. Data Collection
Free from the Internet, we can collect the following data.
In chapter 5, we will show you how to do this.
Intel Corporation (INTC)
Monthly prices (Nov 1991 to Nov 1998)
DATE HIGH LOW CLOSE VOLUME 5m Avg
Nov-91 5.531 4.969 5.125 275020000
Dec-91 6.156 5.031 6.125 260759200
Jan-92 7.875 5.906 7.484 589994400
Feb-92 8.594 7.375 7.938 340300800
Mar-92 8.438 6.438 6.906 424595200 6.7156
Apr-92 7.406 6.125 6.688 443011200 7.0282
May-92 6.844 5.813 6.25 300004000 7.0532
Jun-92 7.219 5.969 7.125 346980000 6.9814
Jul-92 7.531 6.844 7.469 291545600 6.8876
Aug-92 7.656 6.781 7.25 197321600 6.9564
Sep-92 8.375 7.219 8.219 301148000 7.2626
Oct-92 8.641 7.594 8.438 389177600 7.7002
Nov-92 9.031 8.313 8.938 261600800 8.0628
Dec-92 11.438 8.875 10.875 480952800 8.744
Jan-93 14.75 10.781 13.344 745068800 9.9628
Feb-93 15 13.031 14.563 601308800 11.2316
Mar-93 15.156 13.906 14.375 506624000 12.419
Apr-93 15.125 10.688 11.891 947040800 13.0096
May-93 14.188 11.906 13.859 422287200 13.6064
Jun-93 15.125 13.219 13.75 357856000 13.6876
Jul-93 14.25 12.313 13.063 308065600 13.3876
Aug-93 16.813 13.063 16.063 373164000 13.7252
Sep-93 18.563 15.063 17.688 320584800 14.8846
Oct-93 18.469 15.375 15.813 505204400 15.2754
Nov-93 16.125 14.063 15.375 390534800 15.6004
Dec-93 16.188 14.063 15.5 372952800 16.0878
Jan-94 17.313 15.188 16.313 493524400 16.1378
Feb-94 17.313 15.125 17.188 347250000 16.0378
Mar-94 18.375 16.25 16.875 415659200 16.2502
Apr-94 17.75 14 15.25 464237200 16.2252
May-94 15.688 14.125 15.625 318720800 16.2502
Jun-94 16.25 14.313 14.625 295517600 15.9126
Jul-94 15.75 14.031 14.813 321685200 15.4376
Aug-94 16.875 14.156 16.438 388840800 15.3502
Sep-94 17.063 15 15.375 325405600 15.3752
Oct-94 15.75 14.344 15.531 419888800 15.3564
Nov-94 16.816 14.938 15.781 415400000 15.5876
Dec-94 16.438 14.375 15.969 531699200 15.8188
Jan-95 17.938 15.75 17.344 498236400 16
Feb-95 20.188 17.281 19.938 388339600 16.9126
Mar-95 22.5 19.594 21.219 488044400 18.0502
Apr-95 26.031 21.125 25.594 515628400 20.0128
May-95 29.75 25.719 28.063 680593200 22.4316
Jun-95 33.188 27.375 31.656 497274000 25.294
Jul-95 39.188 31.25 32.5 558346000 27.8064
Aug-95 33.625 28.563 30.688 493254400 29.7002
Sep-95 33.313 28.625 30.063 361194200 30.594
Oct-95 35.688 28.875 34.938 436342200 31.969
Nov-95 36.57 29.938 30.438 408954800 31.7254
Dec-95 32 27.594 28.375 310609400 30.9004
Jan-96 29.688 24.906 27.617 598129600 30.2862
Feb-96 30.813 27.43 29.406 283989000 30.1548
Mar-96 30.125 25.75 28.438 346666000 28.8548
Apr-96 35.188 28.188 33.875 413220000 29.5422
May-96 37.813 33.25 37.75 318156400 31.4172
Jun-96 38.875 35.125 36.719 278154800 33.2376
Jul-96 37.945 32.063 37.563 491226800 34.869
Aug-96 41.625 37.438 39.906 309881200 37.1626
Sep-96 49.75 39.25 47.719 322253000 39.9314
Oct-96 57.125 47.125 54.938 445910000 43.369
Nov-96 63.625 54 63.438 418029200 48.7128
Dec-96 70.75 61.688 65.469 451772200 54.294
Jan-97 82 63.813 81.125 557706400 62.5378
Feb-97 82.5 68.5 70.938 539579800 67.1816
Mar-97 75.125 62.875 69.563 545409600 70.1066
Apr-97 76.75 64.125 76.563 618080200 72.7316
May-97 84.875 70 75.75 596148200 74.7878
Jun-97 77.313 70.375 70.906 525439200 72.744
Jul-97 92.125 69.313 91.813 473075200 76.919
Aug-97 102 89.875 92.125 352819700 81.4314
Sep-97 99.25 92 92.313 258597900 84.5814
Oct-97 95.625 69.25 77 496699800 84.8314
Nov-97 81.75 72.016 77.625 318099500 86.1752
Dec-97 81.75 67.375 70.25 353535700 81.8626
Jan-98 82.875 70.5 81 339559700 79.6376
Feb-98 95.625 82.188 89.688 333269000 79.1126
Mar-98 91.375 74 78.063 425380400 79.3252
Apr-98 85.063 71.313 80.813 386529700 79.9628
May-98 85.438 71.25 71.438 271927700 80.2004
Jun-98 77.625 65.656 74.125 360081300 78.8254
Jul-98 88.25 72.25 84.438 396391200 77.7754
Aug-98 92.625 70.938 71.188 440267900 76.4004
Sep-98 89 69.75 85.75 369103300 77.3878
=========================================
Oct-98 90.813 75.813 89.188 393720800 80.9378
We will split the data into two parts:
3. Preprocessing
To remove the noise, we will use the 5-month moving average,
which is listed in column 6. Because this is monthly historical data, we
will predict the 5-month moving average of Intel for the next month.
Step 1. Prepared Input file
From the above raw data, set up the Intel file (5-month moving-average) in the following manner:
The input file is:
Purpose: To predict next month Intel.
Data set: 5-month moving average of Intel, Nov-91 through Sep-98
Next 5-month moving average:
10/98 80.9378
*
1
6.7156
7.0282
7.0532
6.9814
6.8876
6.9564
7.2626
7.7002
8.0628
8.744
9.9628
11.2316
12.419
13.0096
13.6064
13.6876
13.3876
13.7252
14.8846
15.2754
15.6004
16.0878
16.1378
16.0378
16.2502
16.2252
16.2502
15.9126
15.4376
15.3502
15.3752
15.3564
15.5876
15.8188
16
16.9126
18.0502
20.0128
22.4316
25.294
27.8064
29.7002
30.594
31.969
31.7254
30.9004
30.2862
30.1548
28.8548
29.5422
31.4172
33.2376
34.869
37.1626
39.9314
43.369
48.7128
54.294
62.5378
67.1816
70.1066
72.7316
74.7878
72.744
76.919
81.4314
84.5814
84.8314
86.1752
81.8626
79.6376
79.1126
79.3252
79.9628
80.2004
78.8254
77.7754
76.4004
77.3878
Purpose: To predict next month Intel.
Data set: 5-month moving average of Intel, Nov-91 through Sep-98
Next 5-month moving average:
10/98 80.9378
*
7.0282
7.0532
6.9814
6.8876
...
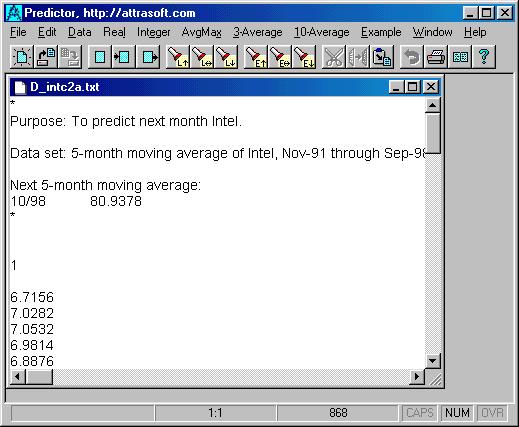
Figure 2. The Intel input file.
Step 2. Link the data to the Predictor
The above input file is in the software:
1. Input File Name;2. Output File Name;
3. Precision level of the prediction;
4. Trend of the prediction.

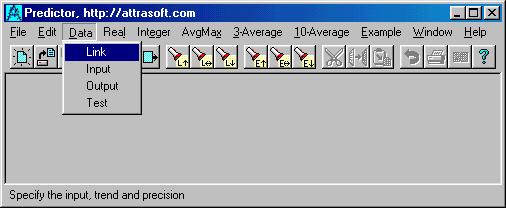
Figure 3. Click command: "Data/Link".
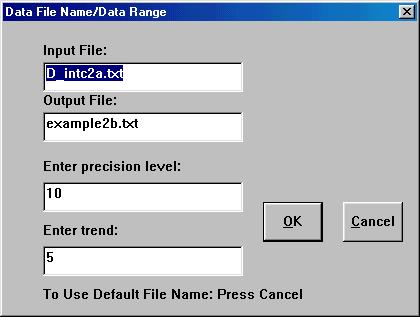
Figure 4. Link the input file to the Predictor
To link the data files, in the first textbox (Figure 4), enter
The linking is completed ... just that easy. We will explain the
other three textboxes later.
Step 3. Click command: "Real/-- Exponential"
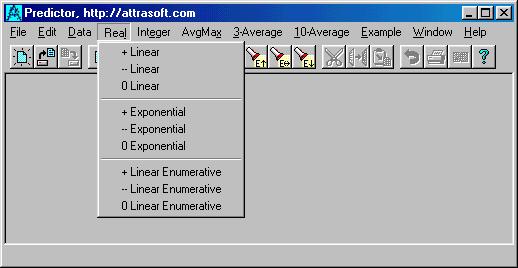
Figure 5. The "Real" Menu.
Figure 5 shows the "Real" menu. "Real" means real number prediction.
The other prediction is "Integer" prediction. Click "Real/-- Exponential"
(second of 2 clicks) to get the answer. The running takes no time,
and the following prediction file is opened automatically (See Figure 6):
=================== Beginning =====================
Possibility Confidence*Probability=================== End ==========================81.2484 6400
77.8113 10344
76.0928 4235
84.6855 273
88.1226 1
86.404 33
79.5299 168
74.3742 8320
82.9669 261
---------------------------------------------------
Weighted Average
77.476
Highest Probability
77.8113 10344
Error of each number
0.859271
As we have shown in the earlier this section, the correct answer is:
Oct-98 80.9378
81.2484 ± 0.859271 0.218 6400
77.8113 ± 0.859271 0.353 10344
76.0928 ± 0.859271 0.144 4235
74.3742 ± 0.859271 0.283 8320
Highest Probability = 77.8113 ± 0.859271
(35.3 % probability)
The probabilities of the predictions roughly calculated as follows:
10344 / (6400 + 10344 + 4235 + 8320) = 0.353
...
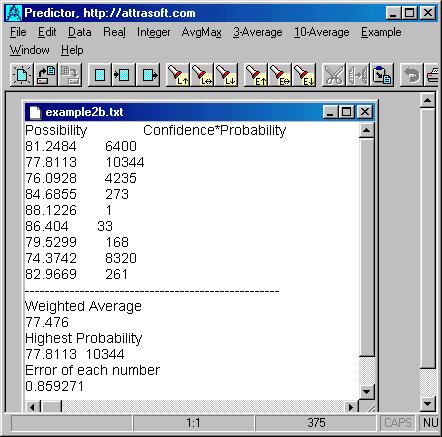
Figure. 6 The results of clicking "Real/-- Exponential" (second
of 2 clicks)