4.3 Trend, Precision and Confidence
4.4 Roles of the Four Parameters
4.6 Using Excel as Your Text Editor
4.7 Data Preprocessing Using Excel
The Predictor uses three parameters:
What is an N-trend? Suppose you have 5 rows of data:
then a 2-trend is the combination of all 2 consecutive numbers together:34
7
2
1,
(3 4), (4 7), (7 2), (2 1).
A 3-trend is:
(3 4 7), (4 7 2), (7 2 1).
A 4-trend is:
(3 4 7 2), (4 7 2 1).
N-trend means the Predictor looks at N rows of data at a
time. This is one of the three specifying parameters used by the Predictor.
The N-trend is a user-selected variable. If you do not make a choice,
the default value is 5.
To change the N-trend (See Figure 4):
Under similar prediction confidence numbers, the longer the Trend,
the more accurate the prediction will be.
You have to balance the two sides of this parameter. On one hand, a
10-trend certainly provides a more accurate prediction than a 5-trend.
On the other hand, a 10-trend prediction requires a much larger volume
of data. One way to increase N is to use preprocessed data. Using the moving
averages can increase N significantly.
The Precision-level determines the error of each variable. The higher the Precision is, the lower the errors are. This is one of the three specifying parameters used by the Predictor. The Precision level is a user-selected variable. If you do not make a choice, the default value is 10.
This parameter will directly change the errors in the output file. To change the Precision level (See Figure 4):
Trend, Precision and Confidence
In general, the longer the trend, the more accurate the prediction will be. The higher the precision, the lower the error(s) will be.
Between these two factors, the Trend is more important than Precision. If possible, always goes for the maximum Trend.
Here is how to set the Trend: as you increase the Trend from low to high, initially, you can see the confidence (rating) increase. If you keep increasing the Trend, for most problems, at certain point the confidence begins to drop. You should establish an acceptable confidence level and that will tell you when to stop.
Example "Example/Intel 2"
Set Trend = 10 and click "Real/+ Exponential" and the output
is:
Can not make a Prediction.
To get a prediction, you can:
(1) Add more data;
If you do not have more data; then click 'Data/Link' and:
(2) Reduce Trend; or/and
(3) Reduce Precision level;
You may also consider:
(4) Reduce the number of variables in your data set.
See the User's Guide
---------------------------------------------------
77.8113 16384
---------------------------------------------------
Weighted Average
77.8113
Highest Probability
77.8113 16384
Error of each number
0.859271
The four parameters have the following impact on the prediction:
Data preparation for a prediction is the most important factor in
the prediction or forecast. Data preparation means two things:
Your data preparation directly influences the results.
In this section, we will show you how to prepare data.
The better you choose variables, the better the potential for the
prediction. This is the single most productive area to work on. You
can increase the information content of your data in several ways:
Data Preprocessing: This approach transforms the existing data into another form. Typically, this is just a mathematical manipulation of the data. A moving average, for example, is a mathematical manipulation of the underlying price variable. This approach may allow us to extract information more effectively or more efficiently. For stock prediction, we always recommend you to use the moving averages of the underlying stock price.
Removing Unnecessary Variables: This approach removes data that does not increase the information content. Overloading the Predictor with useless or redundant information will increase the complexity of the computation exponentially and will require more data. If you do not have enough "rows" for the additional variables, the quality of the prediction can be reduced. Averaging Intel and Microsoft stock prices, for example, is a mathematical manipulation, which covers both factors with only one number.
Increase Data Volume: This approach increases the data volume. Two years of data, for example, is better than one year of data, if the conditions in these two years are basically the same. In reality, there is a limit to the data volume. For the Attrasoft Predictor, always go for the maximum amount of available data. The cost of increasing data volume in computation time is almost 0. The data volume is not a factor in the Attrasoft Predictor, for the software is designed for terabyte processing.
Using similar data: It is quite possible that sometimes you have
no data. In this case, you might consider using similar data. We will present
you with an example in which, despite not having Intel data, we still want
to predict Intel stock by substituting Intel with Microsoft, because Microsoft
stock is similar to Intel stock. As you will see, the Predictor
will still be able to make a direct hit.
Using Excel as Your Text Editor
Almost any word processor can be used as the text file editor, Microsoft
Word, WordPerfect, Windows Notepad, ..., as long as you save the files
in text format. We recommend you to use Microsoft Excel as a text
editor. First of all,
Secondly, Excel gives you the power to manipulate the data easily.
The functions in Excel you might use repeatedly are:
Data Preprocessing
Using Excel
Data preprocessing transforms the existing data into another form. Typically,
this is just a mathematical manipulation of the data. A moving average,
for example, is a mathematical manipulation of the underlying price variable.
This approach may allow us to extract information more effectively or more
efficiently.
When dealing with data with noise fluctuations, like stock market prediction, always use the moving averages of the underlying variables.
If there are noise fluctuations in the data, these noises can be removed from the data by a simple procedure like moving average. However, if the noise fluctuation is left in the data, the Predictor will think these noise fluctuations are meant to be learned and will treat the noise fluctuations as well-defined patterns in the data. As a result, it will shorten the Trend and reduce the Precision of a prediction.
It is an easy job to convert the original data to the moving average
data. There are only two steps to convert the data:

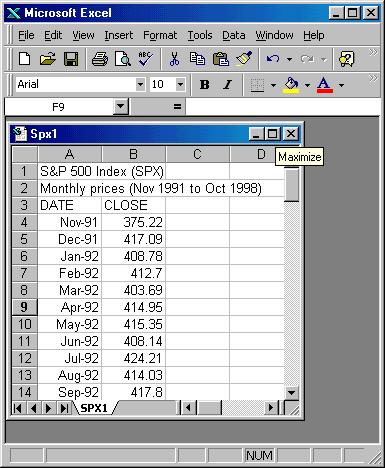
Figure 10. SP 500 data in Excel.
The data is as follows:
A
B
C
|
3
|
DATE | CLOSE |
|
4
|
Nov-91
|
375.22
|
|
5
|
Dec-91
|
417.09
|
|
6
|
Jan-92
|
408.78
|
|
7
|
Feb-92
|
412.7
|
|
8
|
Mar-92
|
403.69
|
|
9
|
Apr-92
|
414.95
|
|
10
|
May-92
|
415.35
|
. . .
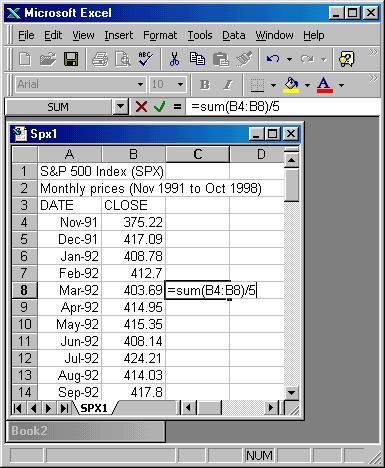
Step 1: at the C8-cell, enter "=SUM(B4:B8)/5".

Figure 11. First moving average of the SP 500 in C8-cell.
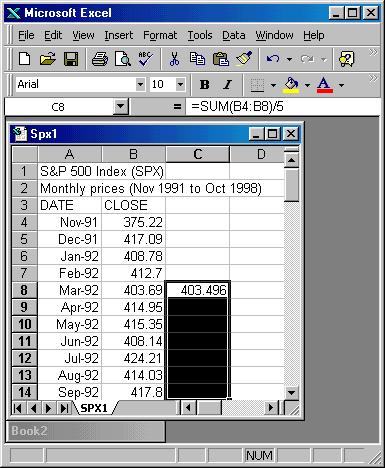
Hit enter and the first moving average is calculated. In this case,
the first moving-average is 403.496 (See Figure 12).

Figure 12. First moving average of the SP 500 is in C8-cell.
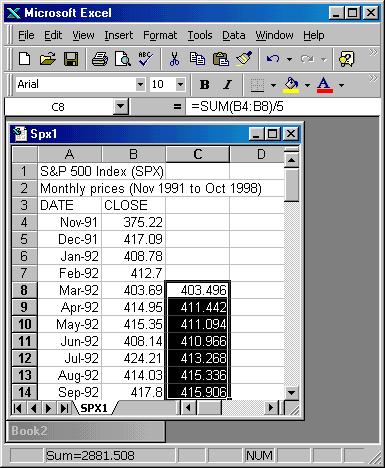
Step 2: Highlight the cells: C8, C9, C10, ... , (See Figure 12) then click: "Edit/Fill/Down".

Figure 13. The rest of the moving averages of the SP 500 in C-column.
In this section, we will compare the result of using the original data and the result of using the moving average data (preprocessed data).
Two examples will be used. Both are packed in the Predictor, which can be generated by clicking "Example/Intel 1" and "Example/Intel 2".
1. Click "Example/Intel 1" and the original data will appear:
6.125
7.484
7.938
6.906
...
71.438
74.125
84.438
71.188
85.75
2. Click "Real/-- Exponential" and the following results will
appear:
73.138 128
95.1938 256
---------------------------------------------------
Weighted Average
87.8418
Highest Probability
95.1938 256
Error of each number
2.20558
To get a prediction, we have to:
Using the 5-Month Moving
Average
1. Click "Example/Intel 2" and the 5-month moving average data
will appear:
7.0282
7.0532
6.9814
6.8876
...
80.2004
78.8254
77.7754
76.4004
77.3878
2. Click "Real/-- Exponential" and the following results will
appear:
81.2484 6400
77.8113 10344
76.0928 4235
84.6855 273
88.1226 1
86.404 33
79.5299 168
74.3742 8320
82.9669 261
---------------------------------------------------
Weighted Average
77.476
Highest Probability
77.8113 10344
Error of each number
0.859271
Again we want to predict the 5-month moving average of the Intel for
Oct-98, which is 80.9378.
Assume the only data we have for Intel is:
DATE HIGH LOW CLOSE VOLUME 5m Avg
Feb-98 95.625 82.188 89.688 333269000
Mar-98 91.375 74 78.063 425380400
Apr-98 85.063 71.313 80.813 386529700
May-98 85.438 71.25 71.438 271927700 80.2004
Jun-98 77.625 65.656 74.125 360081300 78.8254
Jul-98 88.25 72.25 84.438 396391200 77.7754
Aug-98 92.625 70.938 71.188 440267900 76.4004
Sep-98 89 69.75 85.75 369103300 77.3878
========================================
Oct-98 90.813 75.813 89.188 393720800 80.9378
(1) Microsoft and Intel are similar; and(2) We do have Microsoft data, as listed below:
Monthly prices (Nov 1991 to Nov 1998)
DATE HIGH LOW CLOSE VOLUME 5m Avg
Nov-91 8.479 7.563 8.104 221809200
Dec-91 9.333 8 9.271 202192800
Jan-92 11.104 9.125 10.021 367232400
Feb-92 10.75 9.417 10.292 348507600
Mar-92 10.854 9.729 9.875 301068000 9.5126
Apr-92 10.771 8.917 9.188 534740400 9.7294
May-92 10.188 9.104 10.083 267308400 9.8918
Jun-92 10.375 8.219 8.75 394200000 9.6376
Jul-92 9.344 8.188 9.094 311299200 9.398
Aug-92 9.375 8.5 9.313 222331200 9.2856
Sep-92 10.25 9.156 10.063 250730400 9.4606
Oct-92 11.281 9.469 11.094 286680000 9.6628
Nov-92 11.875 10.906 11.641 306790400 10.241
Dec-92 11.75 10.656 10.672 283332000 10.5566
Jan-93 11.75 10.563 10.813 352832800 10.8566
Feb-93 11.281 9.594 10.422 387085600 10.9284
Mar-93 11.781 10.156 11.563 299489600 11.0222
Apr-93 11.844 9.969 10.688 324658400 10.8316
May-93 11.938 10.563 11.578 326112000 11.0128
Jun-93 12.25 10.844 11 304052800 11.0502
Jul-93 11.063 9 9.25 488353600 10.8158
Aug-93 9.906 8.797 9.391 467870400 10.3814
Sep-93 10.531 9.156 10.313 290615200 10.3064
Oct-93 10.719 9.75 10.016 342688000 9.994
Nov-93 10.375 9.5 10 241628800 9.794
Dec-93 10.813 9.906 10.078 233696000 9.9596
Jan-94 10.875 9.906 10.641 308412800 10.2096
Feb-94 10.719 9.75 10.313 342180000 10.2096
Mar-94 11.156 9.969 10.594 344377600 10.3252
Apr-94 11.906 10.25 11.563 467880000 10.6378
May-94 13.441 11.359 13.438 407473200 11.3098
Jun-94 13.656 12.313 12.906 609798800 11.7628
Jul-94 12.938 11.719 12.875 381991600 12.2752
Aug-94 14.813 12.875 14.531 322749600 13.0626
Sep-94 14.563 13.719 14.031 241212400 13.5562
Oct-94 15.938 13.469 15.75 301788800 14.0186
Nov-94 16.281 15.188 15.719 256071600 14.5812
Dec-94 16.063 14.688 15.281 264838400 15.0624
Jan-95 16.313 14.563 14.844 277902400 15.125
Feb-95 15.813 14.594 15.75 249664400 15.4688
Mar-95 18.531 15.688 17.781 353931200 15.875
Apr-95 20.531 17.188 20.438 324892800 16.8188
May-95 22.375 19.719 21.172 333260000 17.997
Jun-95 23.094 20.438 22.594 317597200 19.547
Jul-95 27.313 22.125 22.625 582714800 20.922
Aug-95 25.188 21.75 23.125 532686400 21.9908
Sep-95 24.469 20.844 22.625 405582400 22.4282
Oct-95 25.844 20.094 25 557034000 23.1938
Nov-95 25.25 21.063 21.781 467730000 23.0312
Dec-95 23.688 21.281 21.938 413403600 22.8938
Jan-96 23.313 19.969 23.125 514154000 22.8938
Feb-96 25.906 23 24.672 409232400 23.3032
Mar-96 26.766 23.656 25.781 424737600 23.4594
Apr-96 28.469 24.906 28.313 336570800 24.7658
May-96 30 27.406 29.688 301832000 26.3158
Jun-96 31.469 29.063 30.031 320025600 27.697
Jul-96 30.719 26.875 29.469 544224400 28.6564
Aug-96 31.531 29.344 30.625 285966000 29.6252
Sep-96 34.656 30.156 32.969 324858800 30.5564
Oct-96 34.781 32.719 34.313 335158800 31.4814
Nov-96 39.5 34.125 39.219 405242000 33.319
Dec-96 43.063 37.066 41.313 364755800 35.6878
Jan-97 51.625 40.375 51 391445400 39.7628
Feb-97 51.75 47 48.75 324288200 42.919
Mar-97 50.5 43.813 45.844 369409600 45.2252
Apr-97 61.313 44.875 60.75 476863000 49.5314
May-97 64.531 57.438 62 324458800 53.6688
Jun-97 67.469 59.125 63.188 242547400 56.1064
Jul-97 75.375 61.625 70.688 423486400 60.494
Aug-97 72.313 65.5 66.094 292267600 64.544
Sep-97 70.125 65.313 66.156 288403800 65.6252
Oct-97 69.813 61.75 65 383345200 66.2252
Nov-97 71.125 64.5 70.75 228992600 67.7376
Dec-97 73.313 59 64.625 359306000 66.525
Jan-98 75.063 62.188 74.594 371527000 68.225
Feb-98 86 75.25 84.75 350504600 71.9438
Mar-98 90.938 79.25 89.5 274981900 76.8438
Apr-98 99.125 86.625 90.125 254744300 80.7188
May-98 91 81.875 84.813 273845600 84.7564
Jun-98 108.563 83.125 108.375 308288100 91.5126
Jul-98 119.625 105.375 109.938 307324500 96.5502
Aug-98 113.75 95.75 95.938 337509900 97.8378
Sep-98 114.625 94.5 110.063 298081100 101.8254
=========================================
Oct-98 110.125 87.75 105.875 410762300 106.0378
So here is the solution. We will use the 5-month moving average of
the Microsoft data to predict Intel. Here is the data:
9.7294
9.8918
9.6376
9.398
...
84.7564
91.5126
96.5502
97.8378
101.8254
80.2004
78.8254
77.7754
76.4004
77.3878
79.0219 26752
76.242 2048
---------------------------------------------------
Weighted Average
78.8242
Highest Probability
79.0219 26752
Error of each number
1.38994
Click "Real/-- Exponential", and we have the similar results:
79.0219 34576
76.242 7936
81.8018 20184
84.5816 380
87.3615 256
62.3426 64
---------------------------------------------------
Weighted Average
79.6091
Highest Probability
79.0219 34576
Error of each number
1.38994
Customized software can be ordered from Attrasoft upon your request
for the following reasons:
http://attrasoft.com